

QC Sharp System
Background
Suri Tani Pemuka (STP) is one of the biggest shrimp operators in Indonesia. In a push to modernize their systems and bring technology into their operations, our team was tasked with creating a system for quality control, specifically in the hatchery division.

Project Overview
QC Sharp (Quality Control Shrimp Hatchery Accurate Rapid Program) is designed for STP to help modernize the operation. It utilizes smartphone scanning capabilities and QR codes placed on ponds and sampling cups to track the product. It’s also designed to integrate with existing modules like warehousing, feeding, and stock procurement. Some of the identified features include water quality monitoring, quality control from data entry, feed scheduling, mature shrimp mortality/mating tracking, shipping and grading, traceability, and reporting.
Key Considerations
The initial proposal was to be solely Oracle-based. However, due to concerns with cellular/wifi signals, the team decided to include Android development but with a more focused usage. This gives the operators the ability to input data while being offline. Additionally, the project needs to serve both the nauplii center and larvae center in order to respond to customer requests related to disease or traceability.
Role
As the sole UI/UX designer on the project, I was responsible for designing the user flow for the whole system, including prototyping and visual identity/branding. Our core team members included a project manager, five developers, and the head of quality control.
Tools Used
Adobe XD, Adobe Illustrator, Adobe Photoshop
Discovery
Understanding Business Process
As a starting point, the team dove into documents and forms used in the day-to-day operations in order to understand the business better. We discussed the specific needs of operators, supervisors, and the head of the division. We also went through existing Oracle modules with which the new system will be integrated in order to understand how the data flows.
Requirement Gathering
Our team was in constant communications with production and quality control team leaders to gather as much information as possible. One of the client’s major pain points to be addressed was the use of paper notes and excel documents for data entry. Performance reports had to be done manually using excel documents. Our job was to streamline data entry, simplify performance report reviews, and integrate traceability reports for customers.


Requirement Verification Workshop
Our next step was to verify the requirements and present an initial user flow, design concepts, and information architecture. I led a simple data reporting exercise in order to figure out what information is crucial to the supervisors and leadership and how they want the information displayed on the report screen.


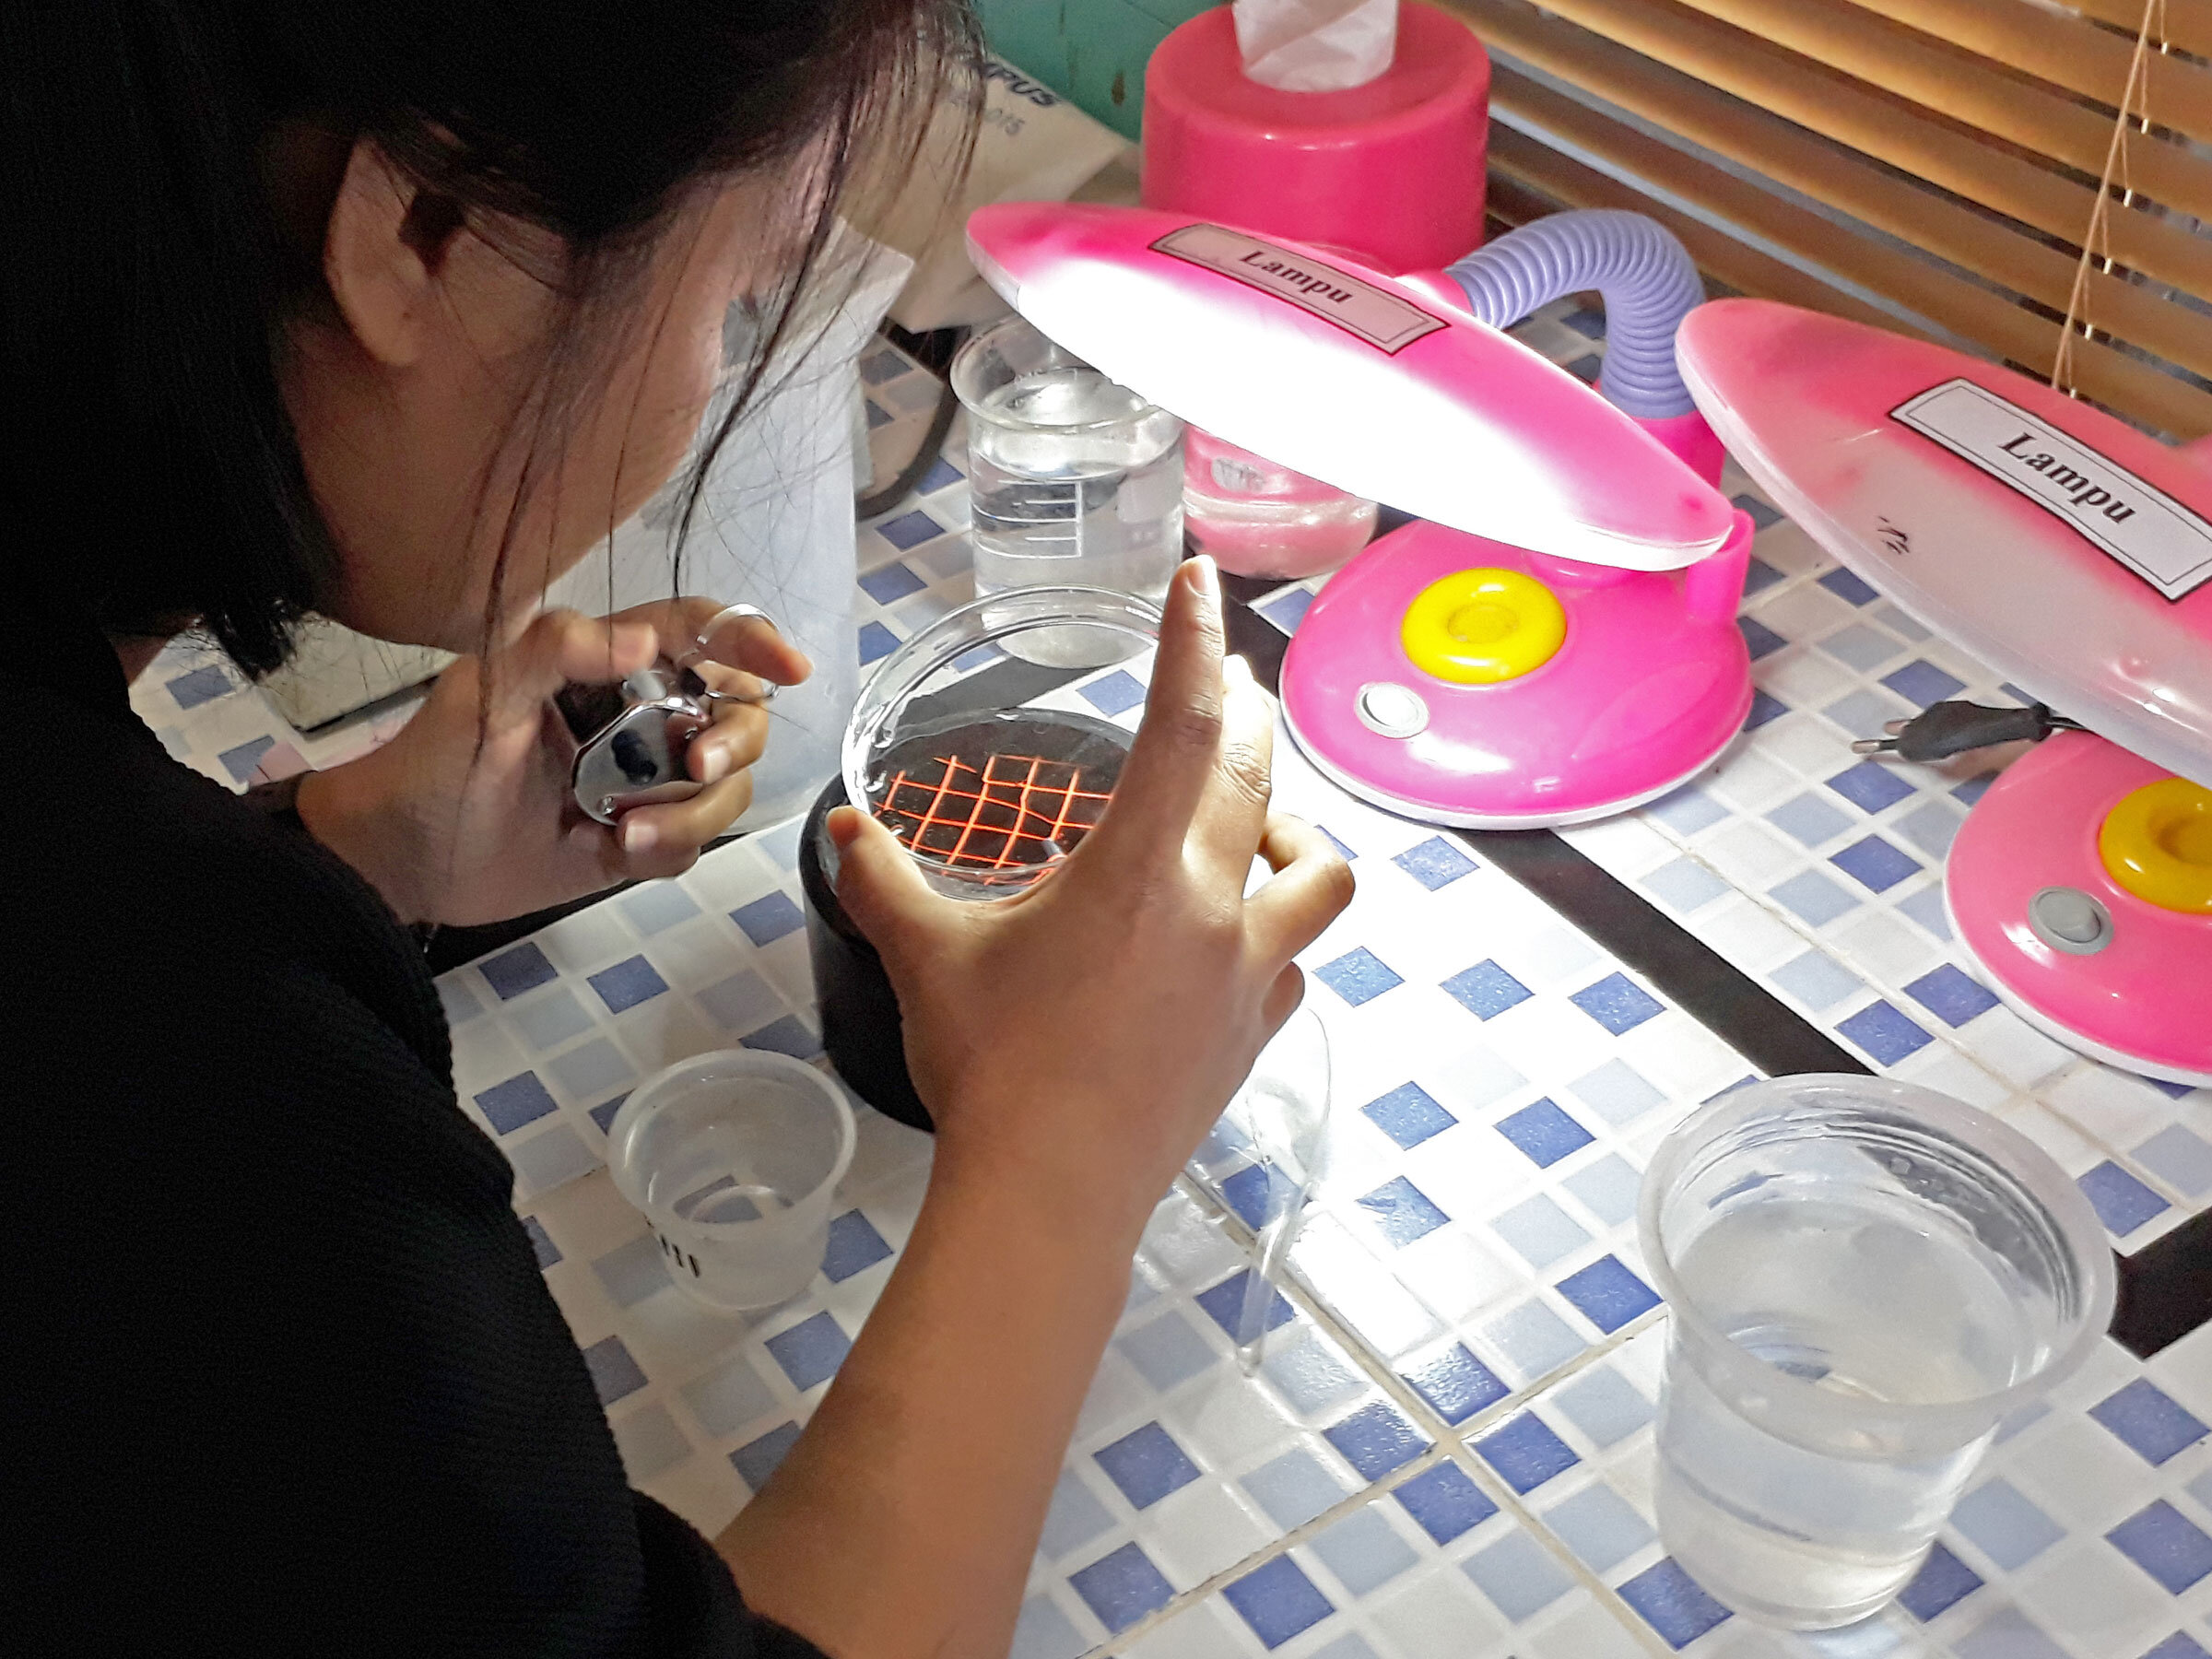
Process Observation
Our team traveled to several hatchery locations to observe the entire production process, including feeding, fry packing and shipping, pond water quality survey, fry quality control and grading, shrimp mating and spawning. We gained better insights into how operators complete their day-to-day tasks as well as working conditions.


Design Process
User Flow
During the initial design process, the team was in constant communication with business process leaders and the head of quality control. We discussed user flows for all features to make sure the user journey made sense. For example, the user flow for water temperature checking and adjusting when the temperature is not within the safe range.

Rapid Prototyping
Once the user flows were agreed upon, I proceeded with rapid prototyping. Having clickable prototypes for every feature was essential to test early designs and to validate my understanding of the business process. Here is an example in which I switched the sampling feature entry point from QR scan (scanning pond number) to sample types based on input from the head of quality control.

This process was done on the web version as well to ensure the new system will work seamlessly with the existing modules and current standard of operating procedure. The following is the screen flow for creating and updating the feeding plan, which can then be viewed by the operators on the mobile phone. This screen flow and layout were based on input from operators and the existing module’s developers.

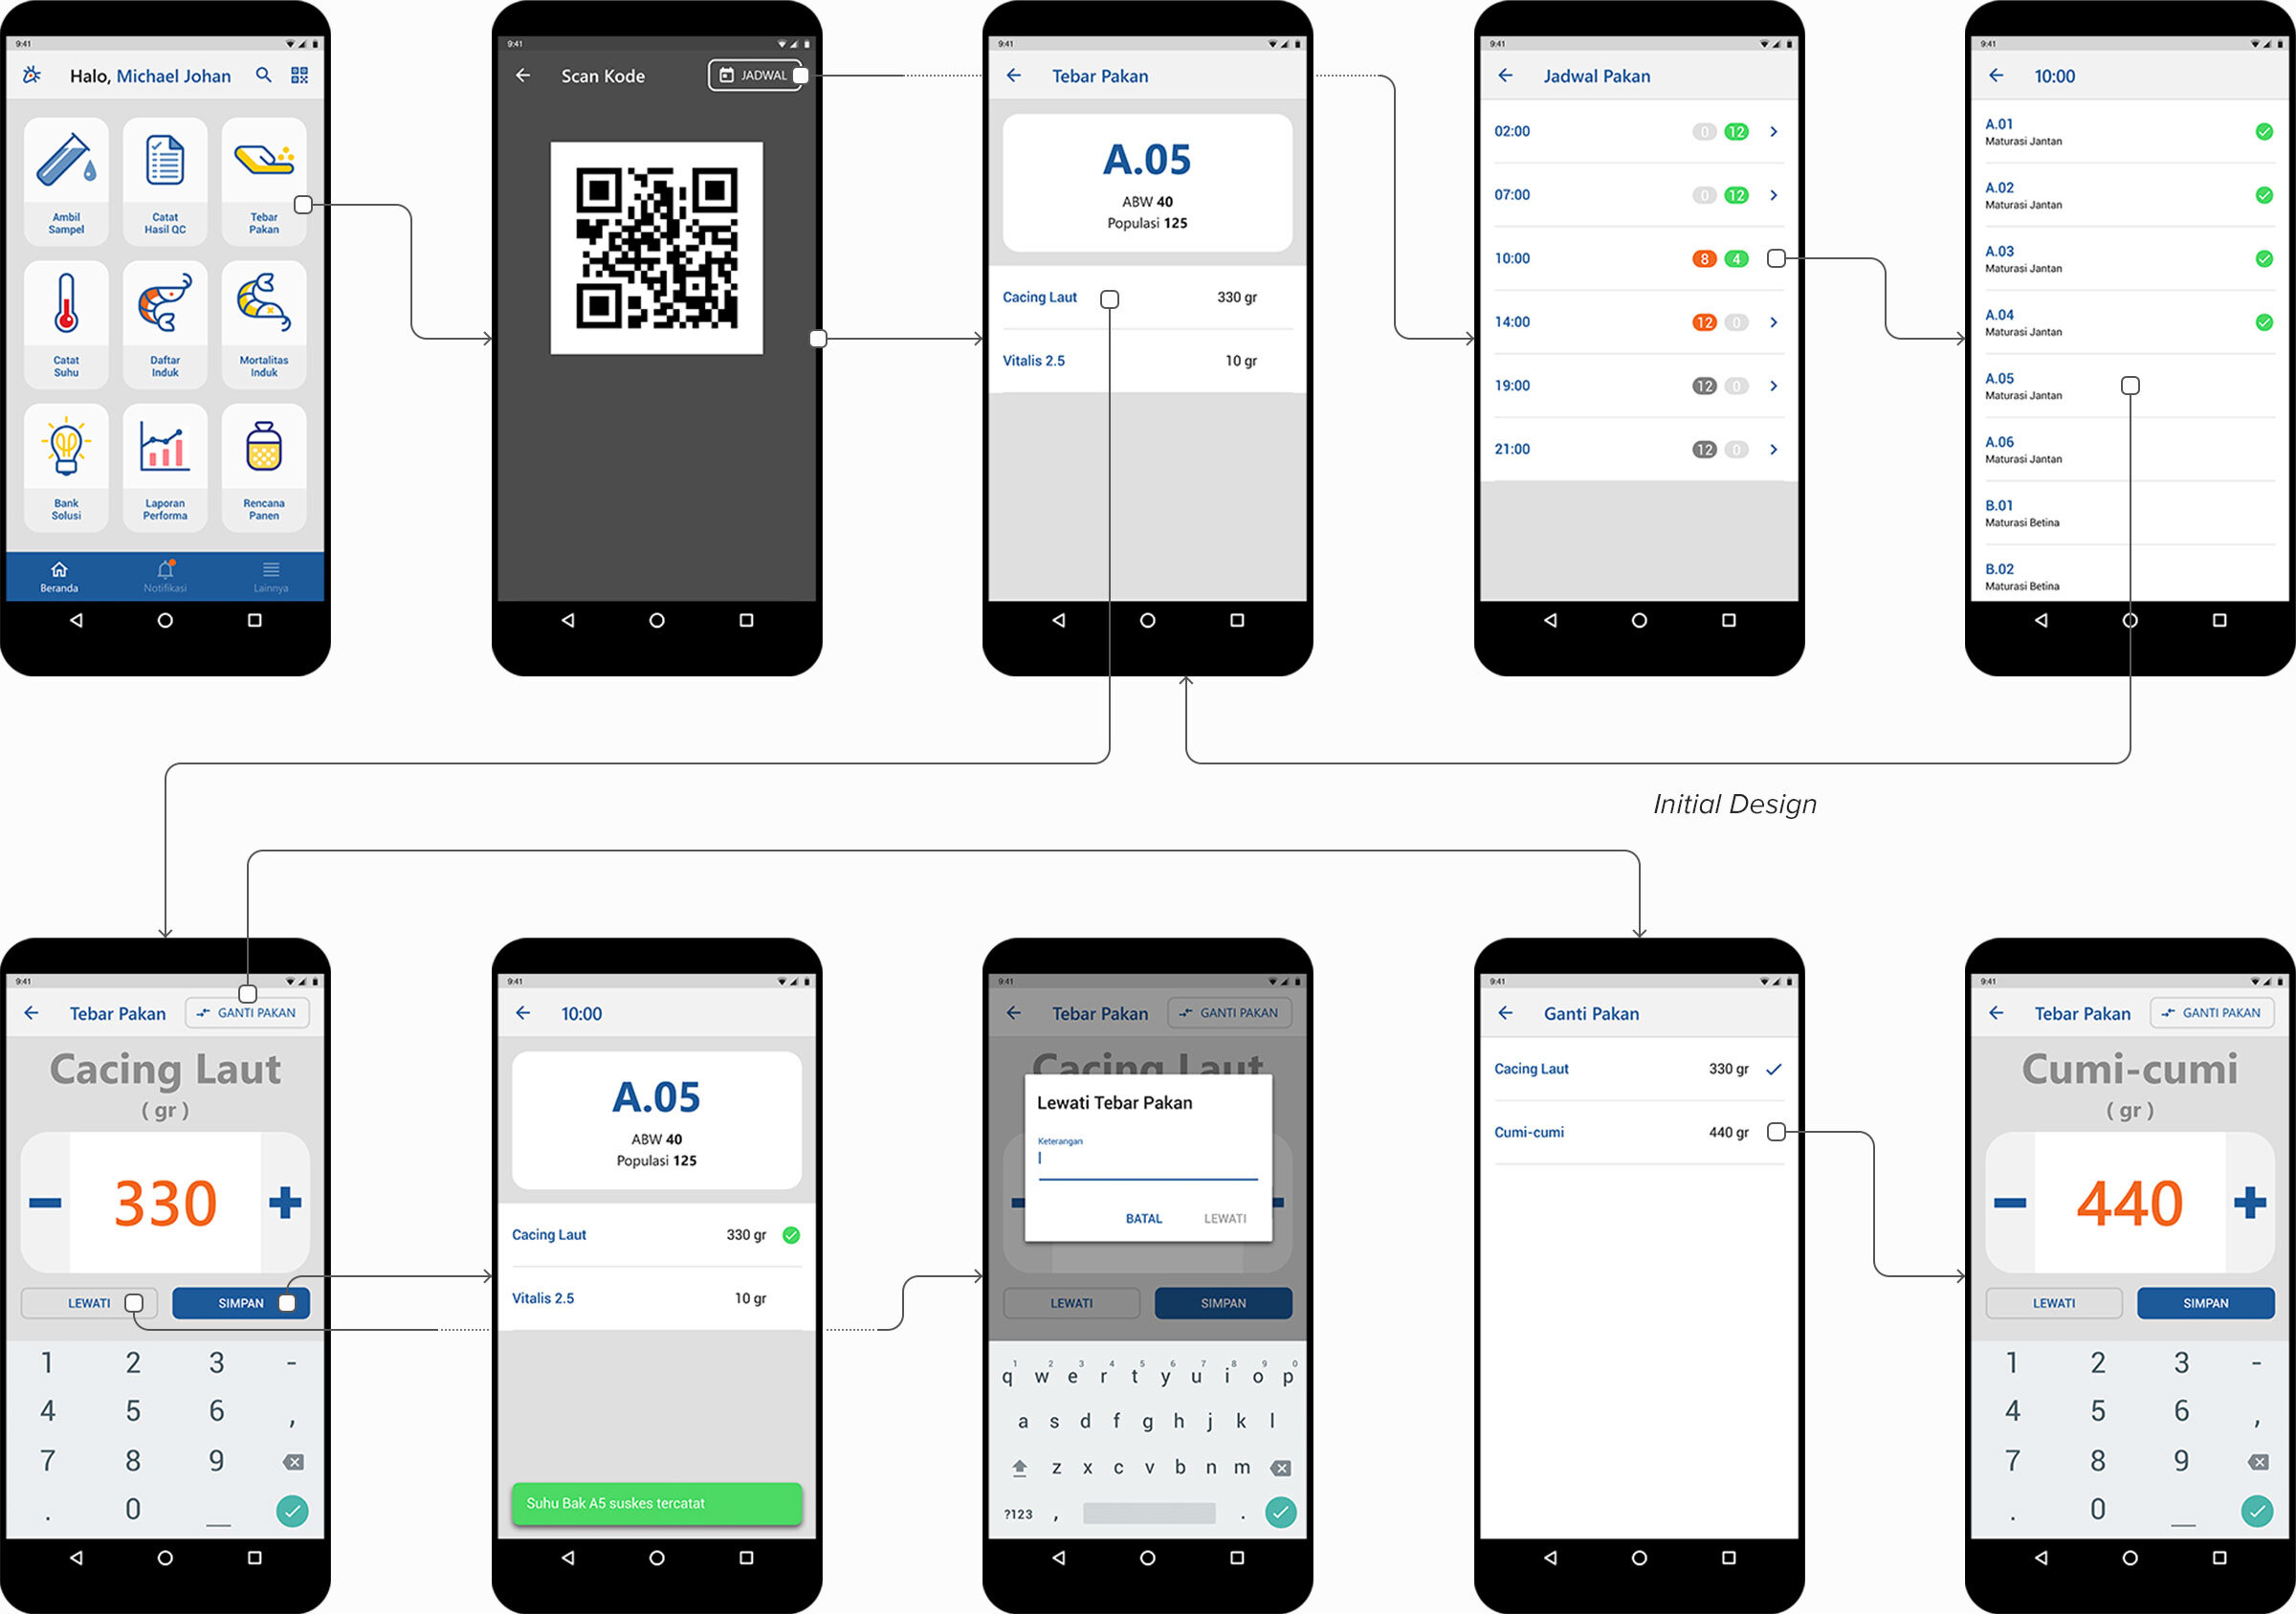
User Test
Remote unassisted prototype testing was done every step of the way for both web and Android. Here is a before and after screen flow for an Android feeding plan which I tweaked after initial design testing. Operators requested more flexibility on Android to change the quantity or add different types of feed based on stock availability.

Final Design
I created the color palette from STP’s brand and Oracle’s built-in system color. I also made an icon library to represent specific features or functions of the system. Lastly, I designed the logo to represent the whole mission of the system. The overall look and feel is designed to be approachable, with an accessible colorful palette and rounded corners.
Colors

Iconography
Logo Design
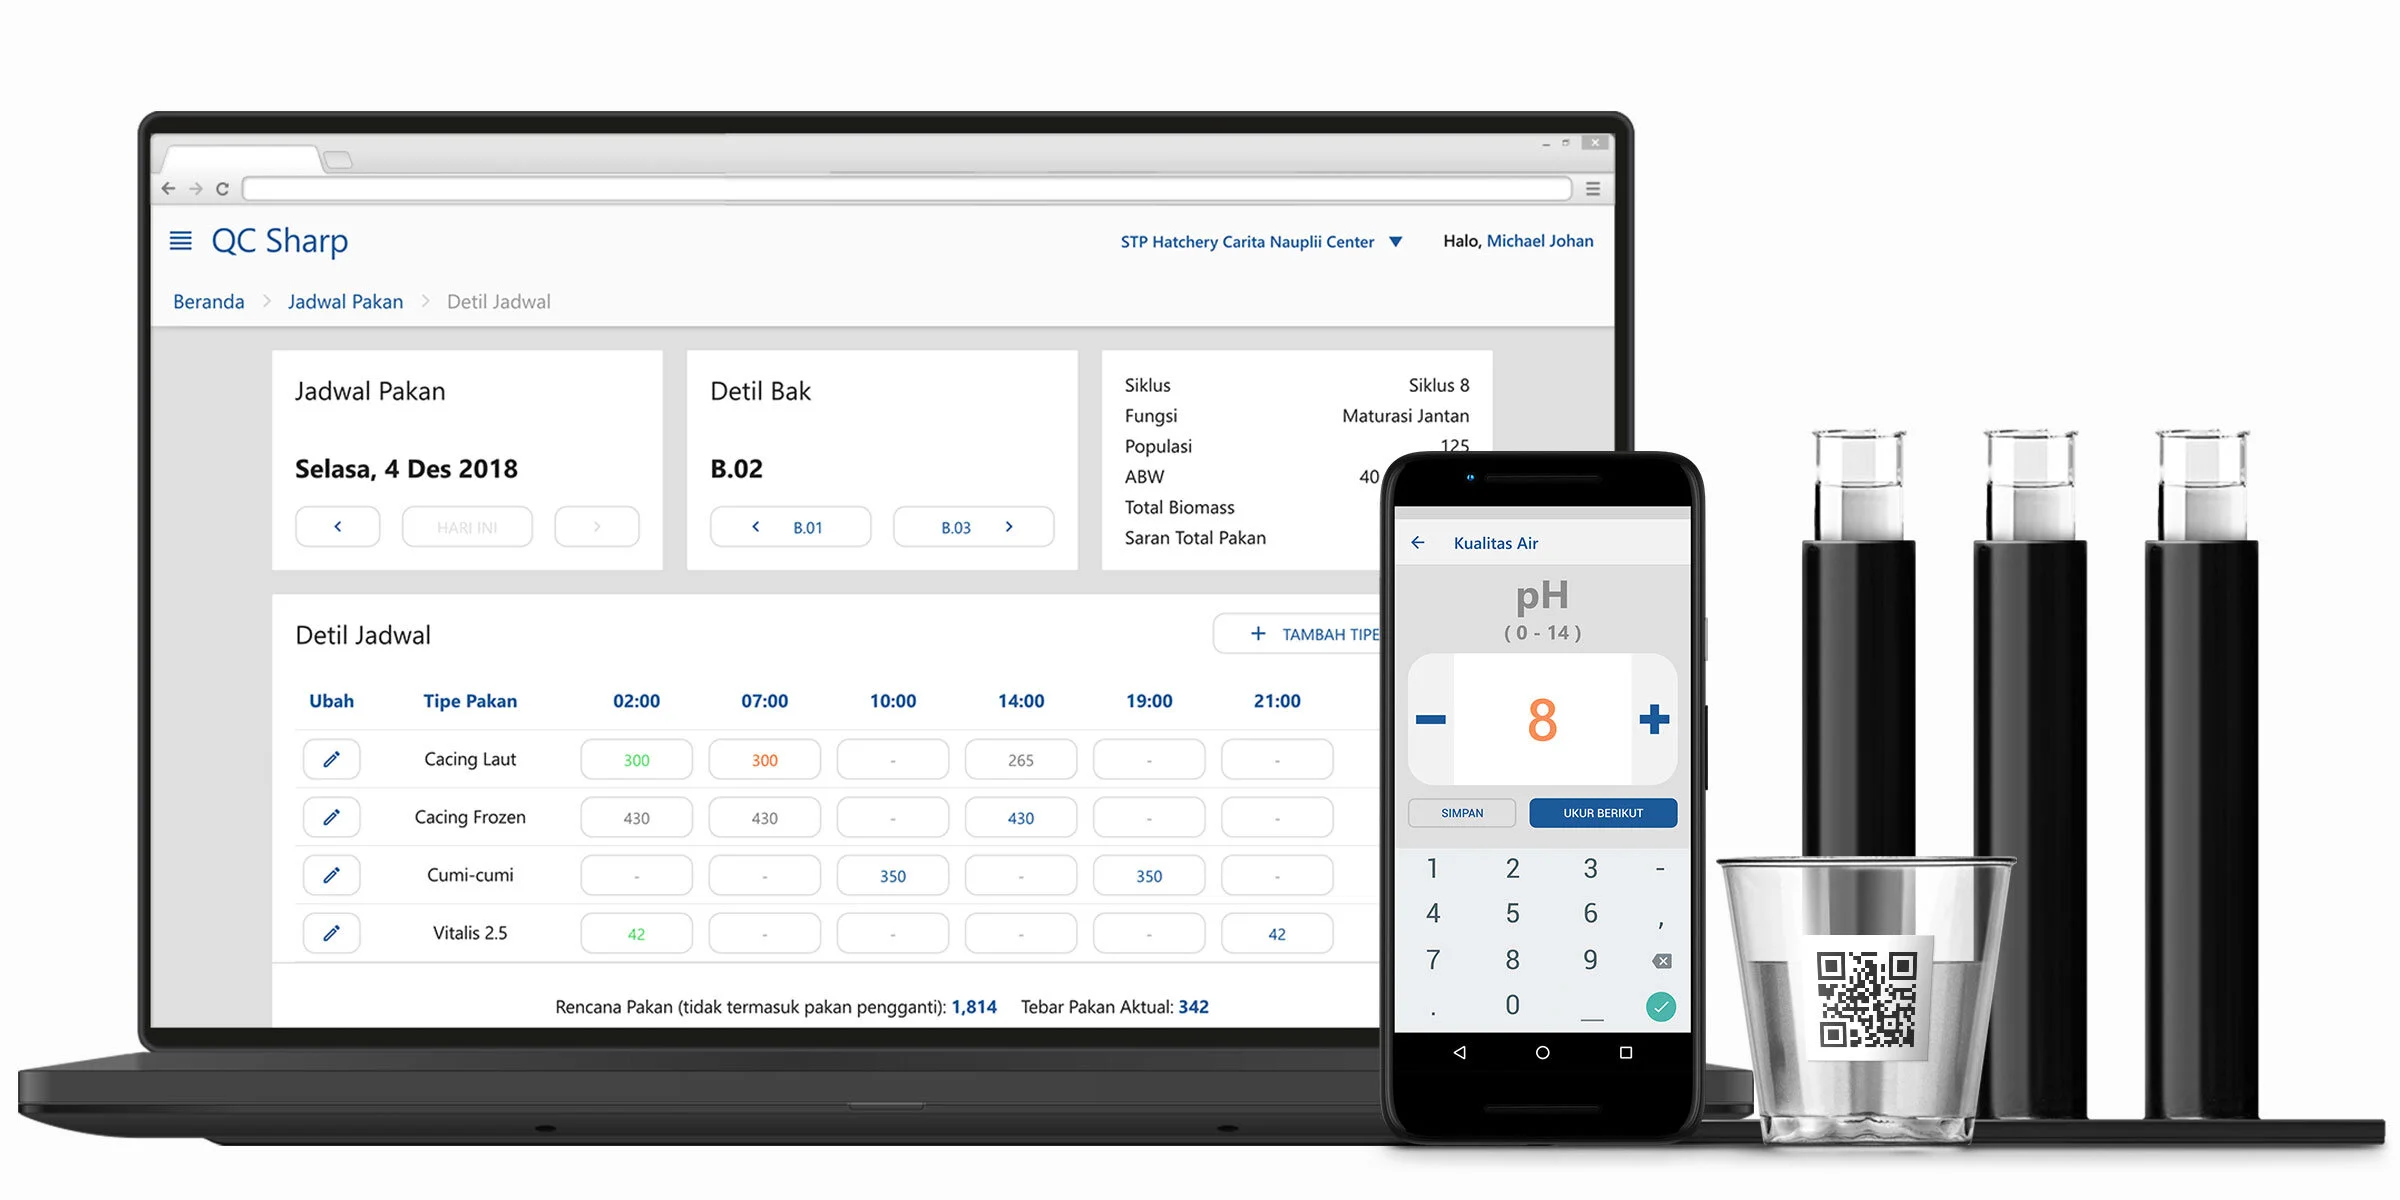
High Fidelity Mockups
One of the design considerations was that the majority of the users are operators responsible for entering data on a daily basis. To reduce cognitive load, the Android app was designed to focus on data entry, while the web was designed to be more robust. Scheduling, master data setting, detailed performance report, traceability report, and data entry are all some of the features available on the web.


Android home, notification, web setting for master data alert, and navigation drawer


Performance report

Quality control forms on mobile and web


